
Study on the digitized and quantified evaluating method for super information characteristics of herbal preparation by infrared spectrum fingerprints
Introduction
The extracts of Ginkgo biloba or its preparation, which is used extensively in at least 130 countries with $5 billion worldwide sales per year, possess antioxidant, anti-ischemia, cardiovascular and cerebrovascular activities (1-4). Numerous studies and relevent regulations or guidelines had been reported to detect the total contents of flavone glycosides and terpene lactones which were much inadequate to represent their real therapeutic effect (5-7). Because the quality of herbal medicines is closely linked to the chemical components and their contents, which vary to certain extend due to different climates, cultivation conditions, harvest time, drying and storage. In addition, the preparation process may vary greatly among different manufacturers (8). Thus, chemical fingerprint methods that tend to focus on identification and assessment of the stability of the chemical constituents have gradually come into practice. Up to date, increasing interest in chemical fingerprint especially HPLC fingerprint (HPLC-FP) analysis can be observed (9,10), however, complex data processing, longer analysis time, and pollution of organic solvent limited its utility in manufacturer’s accompanying inspection. Therefore, fourier-transform infrared spectroscopy (FT-IR) is considered as an alternative identification technique to replace traditional method, since it is a highly reproducible analytical technique and can be handled fast and easily. However, when applied to traditional Chinese medicine (TCM) and herbal drug (HD) such complex mixture system, the absorbtion bands denote the total superposition of various chemical composition. It is characterized by wide absorption band, less absorption peaks, poor characteristic and decreased specificity (11,12). Therefore, how to extract more information from the macroscopical fingerprint profile is particularly important to the final quality evaluation by this method. Cheng et al. (13) adopted multivariate statistics based on bayes rule to realize the visual expression of characteristic fingerprints relating to infrared spectral analysis data. Xu et al. (14,15) proposed ‘infrared macro-fingerprint method’ combined with second derivative spectroscopy, and two-dimensional infrared (2D-IR) correlation spectroscopy to enhance the fingerprinting characteristics of the spectra. With the development of advanced techniques with tremendously complicated fingerprint data, distinguishing the minor differences between the recorded fingerprints based on certain mathematical methods is becoming more important.
In this paper, we developed the infrared fingerprint (IRFP) as a fast, accurate, and effective method to reveal the complex system of ginkgo tablet (GT). Meanwhile, zero and first derivative infrared fingerprint were both established to distinguish samples. All calculation was according to the spectral data points from 4,000-400 cm-1, using technique of computer aided analysis and mathematical methods. And the change of the multidimensional super information cluster combined with infrared spectrum fingerprint quantified method (QIFM) account for the final evaluation. An effective, practical, simple and accurate method came into being to display the overall quantitative characteristics of the TCM with the feature of complex giant system by using IRFP.
Theories for digitized super information of IRFP (16-20)
IRFP index theory
Fingerprint point n
Each peak point in IRFP is considered as fingerprint point, which represents the total absorbency of various compounds (thoroughly saturated and unsaturated compounds effectively detected). Using all peak points of IRFP to quantitatively evaluate the overall TCM quality possesses the advantages of abundantly, accurately and briefly quantitative information that was a very important innovation for TCM quality assurance.
Fingerprint separation ratio (β)
Fingerprint separation ratio was defined to reflect the peak point numbers and purity of monochromatic light seen in Eq. [1], where, d (nm), n, б1 and б2 is the adjacent wavenumber interval of a continuous spectrum, slit width, fingerprint points, the starting and ending wavenumber of scanning, respectively. The bigger fingerprint point number and the much purer of monochromatic light, the larger β, usually is the one.

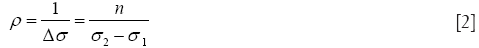
Fingerprint frequency ρ
ρ is termed as the number of peak points obtained in unit wavenumber, seen in Eq. [2], which usually is within (0.5, 2).
Fingerprint total signal intensity (LR)
Fingerprint total signal intensity (LR) is defined as the total sum of each fingerprint point absorbance, seen in Eq. [3], which represents the total signal overlap intensity of all fingerprint points, where is the absorbance or transmittance under the ith wavenumber.

Fingerprint AUC
Fingerprint AUC is the integral area under curve of an infrared spectrum that is performed by Simpson’s integral method, so it is another index to reveal the total contents of chemicals in TCM. When ρ is one, AUC and LR are equal.
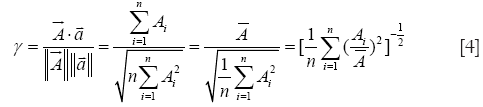
Leveling coefficient of peak signal γ
Leveling coefficient of peak signals γ is termed as the intersection angle cosine of and
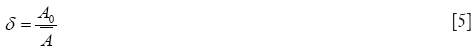
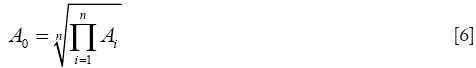
to reveal how uniform are the fingerprint signals, seen in Eq. [4]. The closer to one for γ, the poorer characteristics of a profile. Likewise, the geometric arithmetic ratio δ is defined as the ratio of the geometric mean of absorbances to the arithmetic mean of absorbances, respectively, seen Eq. [5], where
and A0 are the arithmetic mean of absorbances and geometric mean of absorbances, separately, seen Eqs. [6,7] that can also reveal how uniform are the peak signals.
Fingerprint space occupying ratio η
Fingerprint space occupying ratio η is defined as the percentage of AUC accounting for the largest spectrum area, seen Eq. [8].
Apparent injection mass Q (mg)
Q is the apparent mass of raw materials or their preparations to be prepared sample crystal plate to analyze during IRFP process, where its unit is 1 mg.
Apparent absorption coefficient E
Apparent absorption coefficient E is defined as the absorbance of extractum of 1 mg raw materials or preparations at a certain wavenumber, where the maximum of Es is usually selected to express the IRFP characteristics, seen Eq. [9].
IRFP index F
Taking the signal response, leveling coefficient, separation ratio and effective information into consideration, IRFP index F is defined to directly indicate the fingerprint information amount, the signal intensity and also the uniformity, seen Eq. [10].

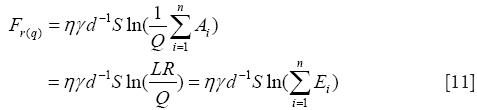
IRFP standard index Fr(q)
Considering the influence of different weighing mass during the process of preparing crystal plate for IR test, IRFP standard index Fr(q) is F corrected to Q =1 mg for further expressing the mass information of a sample, seen Eq. [11].
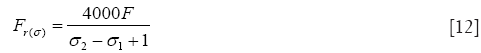
Fixed wavenumber index Fr(б)
Besides the fingerprint information amount and the signal intensity and uniformity, Fr(б) is termed as Eq. [12] that can reveal the spectrum efficiency of the whole profile at a fixed wavenumber.
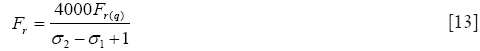
The relative index Fr
Fr is defined as a comprehensive relative index that shows the relative information acquired on the condition of a fixed wavenumber and per unit injection mass, seen Eq. [13]. If the number of fingerprint points is 1,000, and Ai is equal 1.0, meanwhile γ, ρ, and β is 1, respectively, then Fr is less than 100.
Information amount theory
Peak point entropy Si
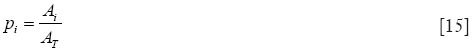
According to Shannon entropy, the fingerprint peak point entropy Si may be defined as Eqs. [14,15], where pi is the normalization value (AT) of each fingerprint point absorbance (Ai).

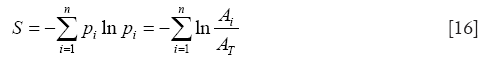
Total fingerprint entropy S
Total fingerprint entropy S is the sum of each peak points entropy Si, seen Eq. [16]. The greater the S the more information reflected by it.
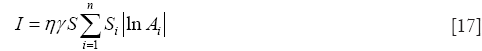
Fingerprint information amount index I
I is defined as the total sum of the natural logarithm of absorbance peak Ai multiplied by the entropy Si, leveling coefficient of peak signal γ and the effective entropy, seen Eq. [17]. So it can comprehensively show how high are the signal responses, leveling coefficient of peak signals and the information amount of the fingerprint profiles.
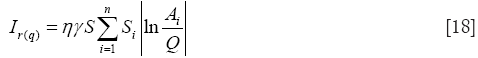
Standard information amount index Ir(q)
Ir(q) is the corrected I by the apparent weighing mass, accounting for 1 mg of the crude drug denoted as Eq. [18]. Besides the signal responses, leveling coefficient of the peak signals and the information amount of the profiles, it can also represent the apparent weighing mass of raw materials or their preparations that will be extracted for sample solution.
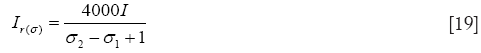
Fixed wavenumber information amount index Ir(б)
In order to express the spectrum efficiency, I is corrected by the fixed wavenumber to get Ir(б) that is shown in Eq. [19], which refers to I multiplied by 4,000 and divided by the difference between the beginning scan wavenumber б1 and the ending one б2 to depict the information contained whether more or less than that acquired at 4,000 cm-1 wavenumber.
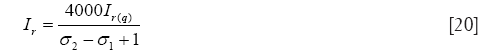
Relative information amount index Ir
Summing the above two factors, i.e., the apparent weighing mass and the spectral efficiency, Ir is defined to display the relative information of chemical constituents in samples, seen Eq. [20]. Not only the signal responses, leveling coefficient of the peak signals, and the information amount, but also the weighing mass of raw materials or their preparations and the spectral efficiency of the profile can be thoroughly described by this parameter.
Inverse ratio of two index ω
In order to compare the difference between F and I, the inverse ratio of the two indexes ω is shown in Eq. [21], which is often less than 1.0. The uniformity gets better as the ω value gets bigger.
The number of arrest points and the central tendency theory
In order to further explore a IRFP fluctuation, the number of arrest points Nsp, the fingerprint range R and the fingerprint range ratio Rstd have been proposed.
The number of arrest points Nsp
Nsp is termed as the number of the first derivatives being zero that are namely the extreme points on the curve, which obviously reveals the fluctuation of a fingerprint profile. The bigger the number the heavier the fluctuation. However, smoothing a profile can cause the number down.
Fingerprint range R
R is the difference between maximum and minimum points on the IR curve, which can characterize the variation of the fingerprint distribution and dispersion degree.
Fingerprint range ratio Rstd
Rstd is defined as the ratio of maximum absorbance and fingerprint range R, seen Eq. [22]. It is another parameter to characterize the variation of the fingerprint distribution and that of dispersion degree as well as R.

Median ratio m
What’s more, the median ratio m is defined as the ratio of the average absorbance to the maximum absorbance, which depicts how closer the fingerprint points are to the central tendency. When m does exceed 0.5, it is denoted that the number of the higher absorbance points is bigger, neither the case nor the number of those is big. If m is to 1, in which the uniformity is the best, but the characteristic of IRFP is very poor, seen Eq. [23].
Fluctuation amount index theory
Fluctuation amount index AF
AF is termed as such an index that takes the fingerprint leveling coefficient, the number of arrest points, the fingerprint range ratio, the effective information entropy and the total responses all into consideration, described as Eq. [24]. It can tell us how about the total signal responses, the effective amount of information, the uniformity and the fluctuation of an IR curve. Actually AF is the sum of each absorbance natural logarithm when γ =1, Nsp =0, m =1 and Rstd =∞. The better leveling coefficient, the higher responses and the larger information amount will contribute to a bigger value of AF.
Standard fluctuation amount index AFr(q)
AFr(q) is the corrected AFr after testing extract from 1 mg of raw materials or their preparation denoted as Eq. [25]. A lot of information including the total signal response, the effective amount of information, the uniformity, the fluctuation of an IR curve and the apparent weighing mass can be comprehensively expressed by this index.
Fixed wavenumber fluctuation amount index AFr(б)
AFr(б) is termed as the corrected AFr by the fixed wavenumber of 4,000 cm-1, seen Eq. [26]. The greater fluctuation positively correlates the smaller wavenumber. AFr(б) synthesizes the spectral efficiency besides the information of AFr.
Relative fluctuation amount index AFr
The above two parameters are simultaneously taken into calculation, the AFr is defined as Eq. [27]. It is such an index that manages to disclose not only the leveling coefficient, the number of arrest points, the fingerprint range ratio, the effective information entropy and the total response but also the apparent weighing amount and the spectral efficiency.
Information fluctuation amount index theory of IRFP
Information fluctuation index AI
In order to establish an index combined the total amount of information with the fluctuation degree, AI is put forth as Eq. [28]. It is a comprehensive index that can simultaneously indicate the fingerprint leveling coefficient, the number of arrest points, the fingerprint range ratio, the effective space information entropy and the total response. If the idealest conditions are met γ =1, Nsp =0 and Rstd→∞, then =1. A bigger value of AI usually means the larger volatility of the effective spatial information.
Standard information fluctuation index AIr(q)
Assumed the most adequate 1 mg of Q, AI is corrected by the apparent weighing amount to be called the standard information fluctuation index AIr(q) denoted as Eq. [29], which refers to the practical AI as Q is corrected equal to 1.0 mg.
Fixed wavenumber information fluctuation amount index AIr(б)
Considering the spectral efficiency, AIr(б) is termed as the corrected index of AI seen Eq. [30], which refers to AI multiplied by 4,000 and divided by the difference between the beginning scan wavenumber б1 and the ending one б2 to depict information contained whether more or less than that acquired in 4,000 cm-1.
Relative information fluctuation amount index AIr
AIr defined as Eq. [31] is introduced for correcting the apparent weighing mass and the spectral efficiency for the same purpose as AFr. It is such an index that manages to comprehensively disclose how high are the leveling coefficient, the number of arrest points, the fingerprint range ratio, the effective space information entropy and the total signal response as well as the apparent weighing amount and the spectral efficiency of the profile.
Inverse ratio of fluctuation indexes aω
The inverse ratio of fluctuation aω is applied to compare the difference between AF and AI just as ω, seen Eq. [32]. The uniformity is positively correlated with the value of aω.
Quantified infrared fingerprint method (QIFM)
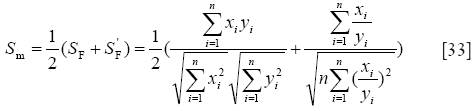
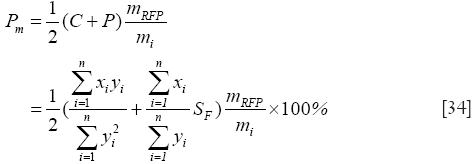
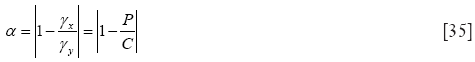
Although the digitized parameter criteria of the supper information characteristics for HD or TCM-IRFP has abundant information, which can not directly provide the detailed quality assurance information. Therefore the accurately qualitative and quantitative measurements of all chemicals have not been performed effectively. Based on the complexity science principle, we proposed a powerful method called QIFM to effectively assess TCM and HD quality levels. QIFM, taking spectral points as the calculating unit, is a method combining the macro qualitative similarity Sm in Eq. [33] with the macro quantitative similarity Pm in Eq. [34] and the relative deviation α in Eq. [35] to simultaneously monitor or identify TCM and HD quality level, in which xi and yi are the peak point absorbance of a sample and the reference IRFP, respectively. Meanwhile mRFP and mi are the reference and sample mass, respectively. The method combined Sm with Pm and α to determine or identify TCM quality level is called QIFM, in which the TCM and HD quality is divided into eight grades in terms of QIFM criteria, listed in Table 1.

Full table
Principle for the development of IRFP
Establishment of reference IRFP
For fingerprinting similarity analysis, one of the most common and easiest applying tools is to establish the reference fingerprint that is a crucial step. As for establishing the reference of IRFP, two following approaches can be employed. One way is to calculate the whole infrared spectral fingerprint points of more than ten batches of the representative TCM raw materials or the extract solution of patent medicines by the averaging method, especially when a greater amount of data is available. The other one is to determine the famous-region drug or standard preparation by continuously for 6 times to develop the mean mode of them. Obviously, the mean or median fingerprint of the data set taken for it usually is more feasible and more likely to achieve the accompanying quantitative analysis. Generally speaking, the reference IRFP can be used as the qualitative and quantitative standard model after eliminating the system error due to the different instruments.
Types and characteristics of IRFP
IRFP for the extract approaches that directly exert an effect upon the stability and reproducibility essentially into four categories: IRFP of water-soluble ingredients, IRFP of liposoluble components, IRFP of whole components and IRFP of effective and characteristic groups. As one of the modern analytical means for the fingerprint testing, the IRFP has the features of swift analysis (analysis time less than 10 min), high stability and repeatability, abundant quantitative information (detect in a wide range of wavenumbers at 4,000-400 cm-1), accurate quantitative analysis and significant digital characteristics. Therefore, quantitative information provided by IRFP with each peak point has the ability to disclose the chemical composition of all chemical bonds from a comprehensive and holistic perspective.
Experimental
Sample information
The 14 batches of GTs were brought from shenyang drugstores to be specified as following. S1 (091103) and S12 (110602) were from the pharmaceutical factory A; S2 (20100901) and S11 (20110601) were from factory B; the others, S3 (20110101), S4 (110101), S5 (110202), S6 (110303), S7 (110406), S8 (1104218), S9 (1105015), S10 (1105251), S13 (110809) and S14 (20110901) were all produced in different factories, respectively. The names of manufacturers had been removed to maintain confidentiality.
Analysis method and sample preparation
Weighed about 1-2 mg of the above powdered and dried GTs into an agate mortar, then 100-150 mg of KBr powder was added. Pressed the uniform mixing sample into a KBr crystals tablet under vacuum with about 10GPa pressure for about 2 min. Accurately weighed the sample KBr crystals tablet.
The fourier transformed infrared (FT-IR) scans were performed on a Bruker IFS-55 type Fourier infrared spectral instrument equipped with a deuterated triglycine sulfate (DTGS) detector (BRUGG GROUP). Spectral scans were recorded between 4,000 and 400 cm-1 at 8 cm-1 resolution. The spectrum were converted to ASCII format and transferred to an Excel file for statistical analysis. A data matrix with 14 rows (14 samples) and 3,734 columns (wavenumbers) was obtained.
Data analysis
Similarity analysis and digital evaluation of IRFP was performed on software 4.0 of digitized evaluation system for super-information characteristics of TCM IR fingerprints (software certificate No: 0474079 China) invented by Prof. Guo-Xiang Sun, etc. The other data processing was in SPSS 16.0.
Results and discussion
Methodology validation
The method was checked for precision and repeatability to ensure that the sample analysis was repeatable and reliable. The precision was determined by 6 times of the same sample in a day. The Figure 1 shows the six infrared spectrum overlap almost completely. The repeatability was investigated by six separate sample preparations. The macro qualitative similarity of Sm and the relative standard deviation (% RSD) was calculated. The results shown that the Sm and % RSD was more than 0.993 and less than 0.18%, respectively. The sample solution stability was evaluated by analyzing a single sample stored in the dryer at room temperature per hours for 6 times. The macro qualitative similarity Sm was found exceeding 0.990 and the % RSD was below 0.38% of it.

Development of the IRFP and analysis
Nine-points smoothing technique was performed for original spectral data in order to remove unwanted variations and increase spectral resolution. The Figure 2 shows the IR spectra fingerprints of 14 GT samples from 4,000 to 400 cm-1 and their reference fingerprint (RFP) which was generated by averaging all of the spectrum. The variation between the 14 samples is significant especially from 1,500 to 400 cm-1 (mainly fingerprinting region). As a kind of macro-fingerprinting feathers of natural product, several characters can be extracted shown in Figure 3, such as, the strongest peak at 3,415 cm-1 belonging to stretching vibration of O-H groups in associated phenolic hydroxyl of flavonoids and phenoliacids, the peak at 2,926 and 1,383 cm-1 assigning to the stretching vibration of -CH2 and -CH3 groups respectively, and the stronger peaks in the range of 1,200-1,000 cm-1 mainly attributed to the stretching vibration of C-O, which displayed the characteristic absorptions of glycosides and terpene lactones.


Evaluate GTs by the super information
The spectral data of 14 batch of GT samples was imported into the above software 4.0. Enormous information of the UVFP contained potentially was presented in Table 2. Part of results were described and analyzed as following: (I) fingerprint separation ratio (β) and fingerprint frequency (ρ) are all one which meet the requirement of fingerprints points numbers and purity degree of monochromatic light; (II) fingerprint total signal intensity LR =773.7-1,117.9, fingerprint AUC =774-1,118, arithmetic mean absorbance =0.207-0.299, and geometric mean absorbance A0 =0.182-0.263, and all above values indicated that the IR spectrum had higher response signals. Among all batches of samples, the response signal of S1 and S12 were the poorest; (III) γ and δ were in the range of 0.792 to 0.924, 0.801 to 0.917 revealed the uniformity of signal better. But relatively speaking, the signal uniformity for S12 was lowest instead of sample S7, which can be also observed in Figure 2 that the amplitude of fluctuation for S12 was more evident in the whole spectrum; (IV) according to the value of Nsp, it was found that bigger fluctuation occurred to S5 instead of S3 and S14. While the value of R and Rstd illustrating the variability and signal discrete degree of S12 was the largest and the reverse yielded to S7. Moreover, it was observed that smaller absorbance point is more as the median ratio m (0.296-0.341) was less than 0.5; (V) according to the values of F (14.7-17.4), S (5.1-5.2), I (41.7-49.8), AF (24.0-76.4), and AI (37.5-120.9), high signal response, good leveling coefficient and rich effective information can be displayed. After the calibration, Fr (20.0-22.7), Ir (70.4-81.1), AFr (34.7-101.7), and AIr (15.2-37.9) were all higher than uncorrected values which were caused by high spectrum efficiency or rich information of chemical ingredients in the extraction. Meanwhile, Fr(б), Ir(б), AFr(б) and AIr(б) were higher than the uncorrected values, approving of the high spectrum efficiency. Likewise, higher value of Fr(q), Ir(q), AFr(q) and AIr(q) attributed to the abundant chemical information sample contained.

Full table
The value of F, I, AF and AI of 14 batches of GT in Table 2 were imported into the SPSS 16.0 after standardization for hierarchical clustering analysis. The Figure 4 dendrogram shown that samples cluster as four classes at the Euclidean distance of 5.0: S1, S2, S6, S8 and S10 were classified in group α; as for S4, S11 and S12, the uniformity and the information contained was poor. Combined with the LR, it can be concluded that S4 was fluctuated at a relatively low signal level, while S11 and 12 were under the opposite condition. Also, it can be seen from Figure 1 that the fluctuation emerged in the region of 500-400 cm-1 and 3,700-3,100 cm-1 for S4 and S11 and 1,300-400 cm-1, 3,700-3,100 cm-1 for S12. Therefore, they fell into group β for lower value of the four parameters (F ≤13.3, I ≤18.0, AF ≤35.6, AI ≤48.0); higher fingerprint space occupying ratio and weaker signal discrete degree contributed to the obviously outstanding AF and AI for S7 which was further grouped as a signal cluster δ; other batches were divided into group γ. Since digital fingerprint characteristics of samples in group β and δ were abnormal, they were considered as outliers.

Evaluate GTs by QIFM
According to the RFP, Sm, Pm and α were calculated and listed in Table 3 as well as quality grades. The result shown that in spite that the number and distribution proportion of fingerprints was almost similar with Sm exceeding 0.95, while quantitative similarity Pm in the range of 78.5 to 116.3 led to final various quality grades. On the basis of the criterion of QIFM, except sample S2, the others were all recognized as not exceeding grade 3. Sample S1 and S12 from manufacturer A all fell into grade 3 due to their too low or high entire content, which approved by the visual difference that the signal of S1 was significantly lower than the RFP instead of S12 in Figure 5. As for sample S2 and S11 shown in Figure 5, though the overall spectra were almost similar, they fell into inconsistent grade for content difference. Generally, it reached a consensus that relatively unstable preparation process may account for the varied entire content between batches in the same factory. Simultaneously, it illustrated the Pm was potent to monitor the content difference from batch to batch as well. Although the total content played a leading role in the final evaluating results, α and Sm managed to reflect the variability and similarity related to the fingerprint profiles to some extent. It can be further validated by the following instance. The abnormal fluctuation of S4, S7 as well as S12 resulted in a larger value of α. In addition, the overall two distinct trends of profile between sample S4 and RFP contributed to the lower Sm. However, obvious discrimination between batches can not be achieved. It was interesting for us to investigate the derivative infrared spectral fingerprints to make further efforts to enhance fingerprinting characteristic.

Full table

Development of first derivative infrared spectrum and similarity analysis
The spectra of 14 batches of GT were converted into first derivative ones and redrawn after magnification by ten times as shown in Figure 6. The derivative spectra enhanced and enlarged the minor difference in the original infrared spectra, and some overlapped peaks can be more clearly recognized for easier comparison and analysis. The typical peaks, from 1,800 to 400 cm-1 were particularly dense, while peaks in the range of 4,000-2,800 cm-1 were more sparse. The profile trend of samples produced by the same manufacturer was basically the same (e.g., S2 and S11). And S4 was obviously different from its other counterparts in the region of 500-400 and 3,700-3,100 cm-1. To further compare the (dis)similarity in detail, RFP was generated by averaging all first derivative spectra to recalculate the macro qualitative similarity.

Results in Table 3 shown that change was more sensitive, agreeing with the lower macro qualitative similarity (Smϵ0.314-0.530) compared with the original. The qualitative parameter of sample S4 (Sm =0.314) was significantly lower than the other batches and thus can be easily recognized and sample S6, S7 and S8 alike. It was proved that the first derivative spectra was capable to strengthen characteristic and sensitivity of infrared spectroscopy when applied to complex mixture. What’s more, it was also confirmed that the IRFP characteristics of super information digital evaluation can unearth detailed information from the macroscopical fingerprinting profiles, overcoming the shortcoming of poor specificity and illegible characteristic related to infrared spectra of complex mixture.
Conclusions
In this study, an accessible and feasible digitized and quantified evaluating method for super information characteristics of TCM IRFP was successfully established and applied to exploit the potential information hidden in GT IRFP. A series of theories such as infrared spectral fingerprint index, fluctuation amount index were proposed to reflect (dis)similarity of fingerprinting profiles and validated by the established first derivative spectra with the features of strong sensitivity and specificity. In addition, using the QIFM, total chemical content differences between samples can be monitored. Based on results from the super digitalized information, QIFM and the first derivative spectra fingerprints, sample S4 and S7 were considered as abnormal ones, the quality of S1, S2, S6 as well as S12 were lower and the rest 8 batches fell into good quality relatively. Our results have demonstrated that employing multi-dimensional digital and quantitative IRFP identification to reveal the characteristics of whole chemical contents is a practical, powerful, reliable and feasible method which can break through the barrier of infared spectra performed on TCM and HD. The method can also be comprehensively implemented on the quality assurance of other TCM concerning accompanying monitoring in manufacturers.
Acknowledgements
This work was supported by the Important Research Plan “Study on the Scientific Action Circumtances Based on the Internet” of National Natural Science Foundation of China (No. 90612002).
Disclosure: The authors declare no conflict of interest.
References
- van Beek TA, Montoro P. Chemical analysis and quality control of Ginkgo biloba leaves, extracts, and phytopharmaceuticals. J Chromatogr A 2009;1216:2002-32.
- Wu Y, Li S, Cui W, et al. Ginkgo biloba extract improves coronary blood flow in healthy elderly adults: role of endothelium-dependent vasodilation. Phytomedicine 2008;15:164-9.
- Abdel-Wahab BA, Abd El-Aziz SM. Ginkgo biloba protects against intermittent hypoxia-induced memory deficits and hippocampal DNA damage in rats. Phytomedicine 2012;19:444-50.
- Rickard NS, Kowadlo N, Gibbs ME. Effect of the Ginkgo biloba extract, EGb 761, on memory formation in day-old chicks. Pharmacol Biochem Behav 2001;69:351-8.
- Ch.P. 2010;I:1079-82.
- Gray DE, Upton R, Chandra A, et al. Quantitative analysis of flavonol glycosides in Ginkgo biloba: a comparison of two analytical methods. Phytochem Anal 2006;17:56-62.
- Li G, Zeng X, Xie Y, et al. Pharmacokinetic properties of isorhamnetin, kaempferol and quercetin after oral gavage of total flavones of Hippophae rhamnoides L. in rats using a UPLC-MS method. Fitoterapia 2012;83:182-91.
- Tang D, Yang D, Tang A, et al. Simultaneous chemical fingerprint and quantitative analysis of Ginkgo biloba extract by HPLC-DAD. Anal Bioanal Chem 2010;396:3087-95.
- Yang DZ, An YQ, Jiang XL, et al. Development of a novel method combining HPLC fingerprint and multi-ingredients quantitative analysis for quality evaluation of traditional chinese medicine preparation. Talanta 2011;85:885-90.
- Chen P, Ozcan M, Harnly J. Chromatographic fingerprint analysis for evaluation of Ginkgo biloba products. Anal Bioanal Chem 2007;389:251-61.
- Joshi DD. eds. Herbal Drugs and Fingerprints Evidenced Based Herbal Drug. Berlin, Germany: Spriner, 2012:Chap. 1. 3-9.
- Maree JE, Viljoen AM. Fourier transform near- and mid-infrared spectroscopy can distinguish between the commercially important Pelargonium sidoides and its close taxonomic ally P. reniforme. Vib Spectrosc 2011;55:146-52.
- Cheng YY, Yu J, Wu YJ. A New Method for Representing Fingerprint Feature: Visualization of Analytical Data of Infrared Spectra. Chinese J Anal Chem 2002;30:1426-30.
- Zhang YL, Chen JB, Lei Y, et al. Discrimination of different red wine by Fourier-transform infrared and two-dimensional infrared correlation spectroscopy. J Mol Struct 2010;974:144-50.
- Xu BL, Zhang GJ, Sun SQ, et al. Rapid discrimination of three kinds of Radix Puerariae and their extracts by Fourier transform infrared spectroscopy and two-dimensional correlation infrared spectroscopy. J Mol Struct 2012;1018:88-95.
- Sun GX, Hu YS, Bi KS. Evaluating the quality of niuhuangjiedu tablets by the systematic quantified fingerprint method. Yao Xue Xue Bao 2009;44:401-5.
- Sun GX, Yang TT, Che L. Quality identification of Liuwei Dihuang Wan by UV- IR spectrum systematic quantified fingerprint. Central South Pharmacy 2010;8:766-71.
- Sun GX, Zhi XZ, Zhang CL, et al. Digitized evaluation system for super-information characteristics of chromatographic fingerprints in traditional Chinese medicine. Central South Pharmacy 2007;5:549-55.
- Sun GX, Hou ZF, Bi YM, et al. The digital criterion of the potential information characteristics of the traditional Chinese medicine chromatographic fingerprints. Acta Pharmaceutica Sinica 2006;41:857-62.
- Sun GX, Li L, Liu Z, et al. Study on the digitized and quantified evaluating method for the super information cluster of traditional Chinese medicine ultravilolet spectral fingerprints. Ann Transl Med 2013;1:30.

